Harness features for assistant QA
Explore how our one‑click harness automates testing, scores responses by meaning, highlights regressions, and delivers clear metrics on every assistant version.
- Home
- Features
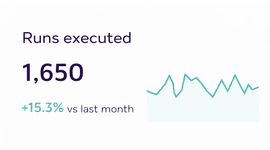
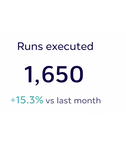
QA dashboard
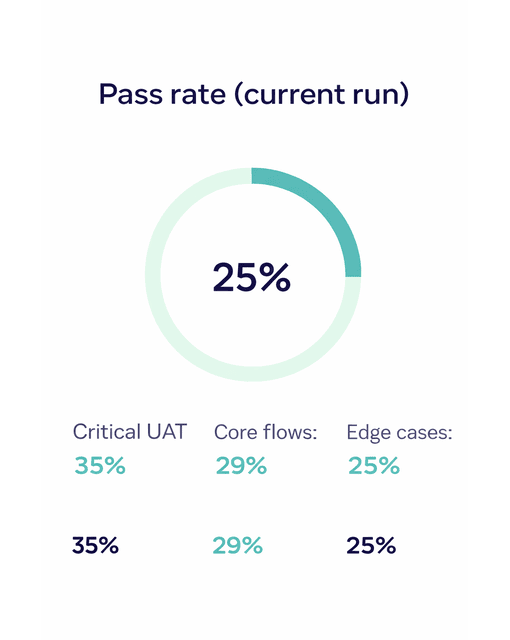
See test, results at a glance
Visualize every run’s pass rate, track regressions by flow, and analyse semantic scores so you know exactly when your assistant is ready to ship.
- Support VAPI & Retell
- No code integration
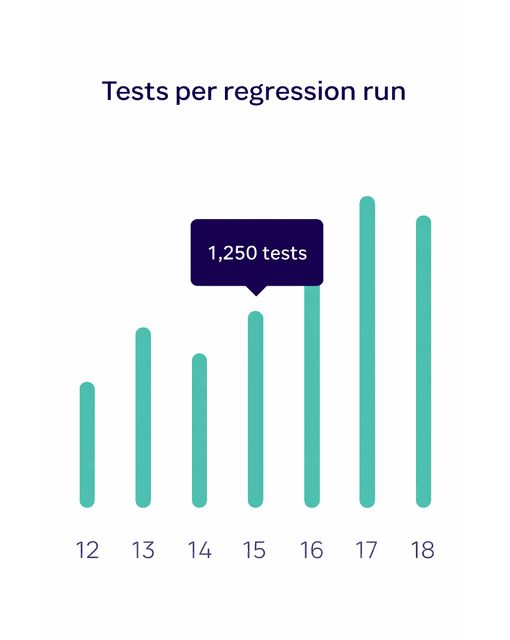
Track suite performance
One dashboard for assistant QA
View pass rates, regressions, and per‑flow metrics in one place so you know exactly when an assistant is ready to ship.
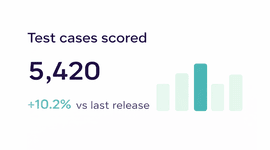
- Semantic scoring
- Regression diffs
Transform QA
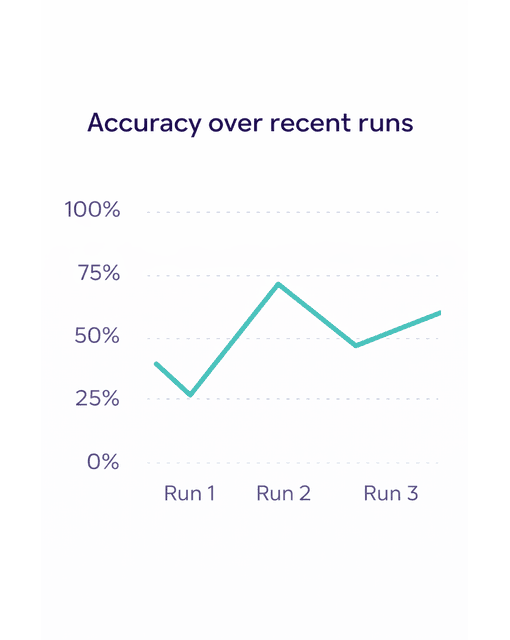
Analyze test results and catch regressions
Supercharge your assistant quality by analyzing every aspect of your test runs and spotting regressions before they hit production.
- Per‑case tags
- Coverage insights
All Features
Discover everything
you can do with EvalVista
Explore our suite of features designed to automate assistant QA, catch regressions, and give you confidence in every release.
Start in staging
Ready to stop manually testing your assistant?
Turn your Excel UAT sheet into a one‑click QA harness.
We help VAPI and Retell teams automate UAT runs, catch regressions, and ship each assistant version with confidence.